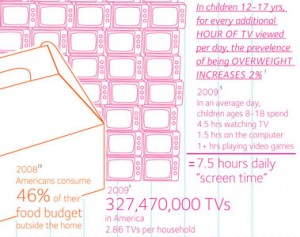
 Michelle Obama’s Let’s Move! campaign against childhood obesity recently announced the winners of the infographic contest it held in partnership with GOOD. Jenn Cash created the design that won “Best Overall.”
The chart graphs the rise in childhood obesity from 1970 to 2026, and features illustrations that represent the increase in soda consumption and total “screen time” American children use daily. The years at the bottom of the graph double as a timeline that marks changes in the American lifestyle. These stepping stones leading to an obesity rate near 33 percent include the year McDonald’s introduces the “Supersize” soda and the year Playstation sold 100 million units.
The information featured in the infographic design was also included in the White House Task Force on Childhood Obesity’s report to the president. The Let’s Move! website describes Cash’s design as “a sobering reminder of what we need to do to make our children healthier.”
View Jenn Cash’s entire design here.
Also Read:
Michelle Obama’s Let’s Move Campaign Has Personal Foundation
Fresh Diet Takes Up Michelle Obama’s Childhood Obesity Cause
Michelle Obama Recruits Baseball Players in Anti-Obesity Campaign [VIDEO]
